Comprehensive Guide to Using a Gantt Chart for Project Management in 2026

In this article

Comprehensive Guide to Using a Gantt Chart for Project Management in 2026
A Gantt chart is a specialized horizontal bar chart used to visualize a project schedule over a specific timeframe. It serves as a foundational tool in project management by illustrating the start and finish dates of various elements within a project. By displaying tasks against time, it allows managers and teams to see what needs to be done and when each activity should occur.
In the current landscape of 2026, the Gantt chart remains a standard for planning because it translates complex project data into a clear, linear format. It helps stakeholders understand the sequence of events and the duration of individual tasks. This visualization is essential for maintaining a high-level view of progress while keeping track of the finer details that drive a project toward completion.
The Essential Components of a Gantt Chart
Every effective Gantt chart consists of several core elements that work together to provide a complete picture of the project. The vertical axis typically lists the tasks or activities, while the horizontal axis represents the timeline. Each task is shown as a bar; the position and length of the bar reflect the start date, duration, and end date of that specific activity.
Beyond simple bars, a modern Gantt chart includes milestones and dependencies. Milestones are significant events or checkpoints that do not have a duration but signal the completion of a major project phase. Dependencies are the links between tasks, showing which activities must be finished before the next one can begin. This relational data is vital for identifying the critical path of a project.
How to Construct an Effective Gantt Chart
Building a Gantt chart begins with a comprehensive list of all tasks required to complete a project. This process, often called a work breakdown structure, involves breaking large objectives into smaller, manageable actions. Once the tasks are identified, project managers must estimate the time required for each and determine the logical order in which they must be performed.
After defining the tasks and their relationships, you input this data into a digital tool to generate the visual schedule. A well-structured Gantt chart should clearly distinguish between different types of work and highlight overlapping tasks. In 2026, automation allows these charts to update dynamically, meaning that if one task is delayed, the rest of the schedule shifts automatically to reflect the new reality.
Key Advantages of Implementing a Gantt Chart
Using a Gantt chart offers significant benefits for team coordination and resource allocation. It provides a "single source of truth" that prevents confusion regarding deadlines and responsibilities. Because the chart is visual, it is much easier to digest than a spreadsheet or a long list of dates, making it an excellent tool for presentations to executives or clients.
- Improved Clarity: It shows exactly how a project is structured and how different pieces fit together.
- Resource Management: It helps managers see if a single team member is overloaded with too many overlapping tasks.
- Progress Tracking: By comparing the planned schedule against actual progress, teams can identify delays early.
- Accountability: Assigning names to specific bars in the Gantt chart ensures everyone knows their specific contributions.
Enhancing Team Presence and Collaboration in 2026
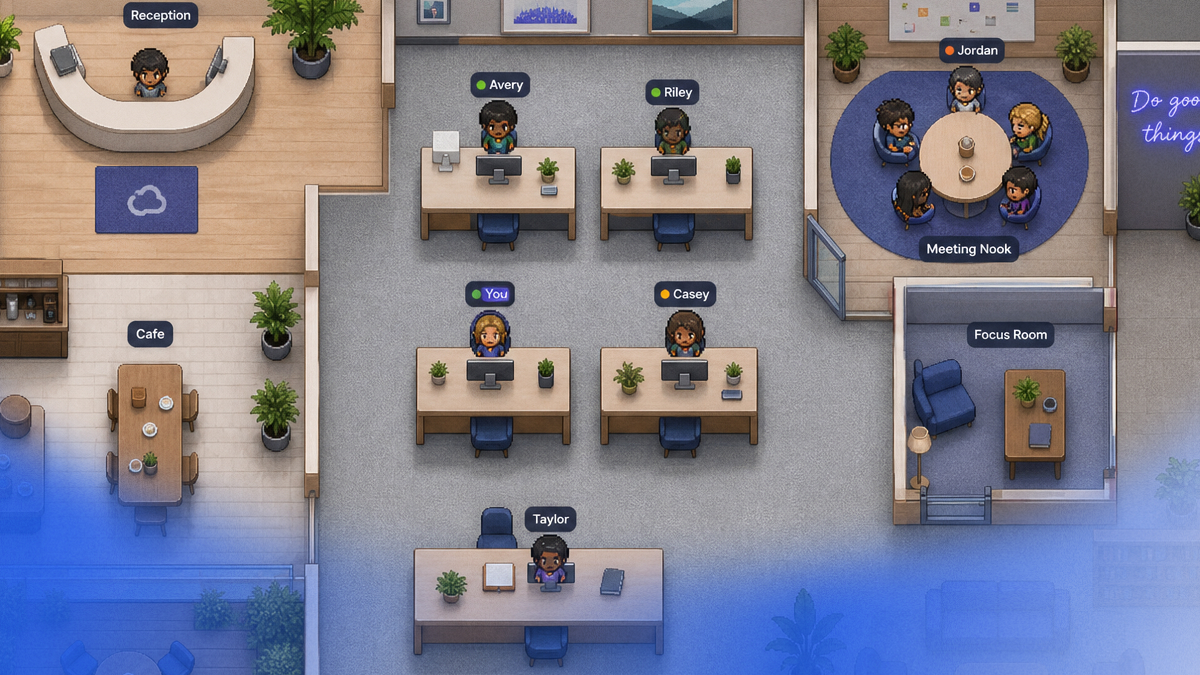
While a Gantt chart is excellent for planning "when" work happens, modern teams also need to know "how" work is happening in real-time. In the remote-first environment of 2026, static planning tools are often supplemented by presence platforms. For instance, hurbly.ai allows teams to see who is currently focused on a task or available for a quick sync without the need for scheduled meetings.
Integrating the structured timeline of a Gantt chart with the real-time visibility of hurbly.ai creates a more fluid work environment. When a project manager notices a delay on the chart, they can immediately see if the responsible team member is available for a spontaneous conversation to resolve the bottleneck. This combination of long-term planning and instant communication reduces the friction often found in distributed teams.
Common Mistakes to Avoid with a Gantt Chart
One frequent error is making a Gantt chart too complex. If a chart contains hundreds of tiny tasks, it becomes difficult to read and maintain, defeating its purpose as a visual aid. It is often better to group small tasks into larger "summary tasks" to keep the visualization clean. Another mistake is failing to update the chart regularly; a schedule that does not reflect the current state of the project is misleading and can lead to missed deadlines.
Furthermore, teams sometimes treat the Gantt chart as a rigid document rather than a flexible guide. Projects are subject to change, and the chart must be adjusted as new information becomes available. By maintaining an accurate and flexible Gantt chart, project leaders can ensure that their teams remain aligned even when unexpected challenges arise during the project lifecycle.
The Future of the Gantt Chart in Digital Workspaces
As we move through 2026, the Gantt chart continues to evolve through integration with artificial intelligence and real-time data streams. Modern project management software now uses historical data to predict task durations more accurately, making the initial setup of a Gantt chart much faster. These advancements ensure that the tool remains relevant for both small startups and large global enterprises.
Ultimately, the Gantt chart is more than just a schedule; it is a communication tool. Whether used for simple task tracking or complex engineering projects, it provides the structure necessary for success. When paired with tools like hurbly.ai that foster spontaneous interaction and digital presence, the Gantt chart becomes part of a comprehensive ecosystem that supports both the planning and the execution of high-quality work.